
Vulnerability of Transportation Networks
INTRODUCTION
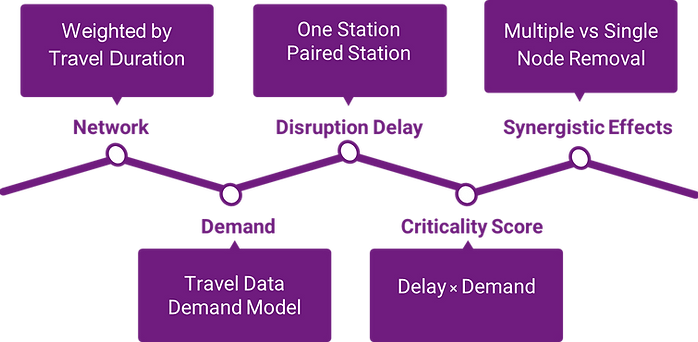
Subway disruptions can lead to major delays with far-reaching impacts on urban economies, security, and quality of life. It is crucial to measure and compare the vulnerability of subway systems of varying network size and
structure.
Objective
Evaluate the impacts of different levels of disruptions in subway system.
-
Single node disruptions
-
Paired disruptions
-
Synergistic effects arising from multiple disruptions
“the whole is greater than the sum of its parts”.
A Tale of 5 Cities
New York City
London
Singapore
Taipei
Washington, DC

RESULTS
Network Structure
The subway system is modeled as a directed network, weighted by time.
Nodes:
-
stations (master nodes)
-
lines within each station (sub nodes)
Edges:
-
travel time
-
transfer time
-
wait time

Constructed Network

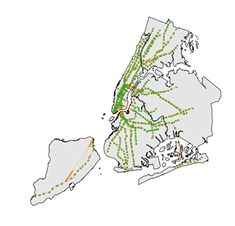
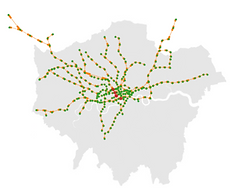

AM Travel Flow
London and Washington, DC
Clear home-to-work flow.
Singapore and Taipei
Passenger flow in more evenly distributed across the network.

Criticality Score
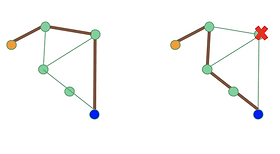

Dijkstra algorithm: shortest network path/ fastest route
X: removed node or pair of nodes
D: delay or difference in travel time between all node pairs
P(a, b): passenger demand between a and b
Measures the total time loss when any node is removed from the network.
Maximum delay is 60 minutes.

Criticality scores by station in London
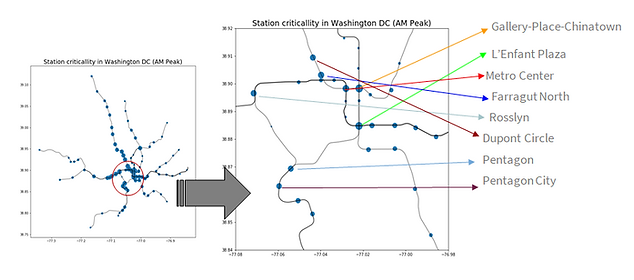
Criticality scores by station in Washington, DC
Synergistic Effects


Positive Synergies
are found in
all 5 cities
Synergies Explained by Network Complexity / Ridership
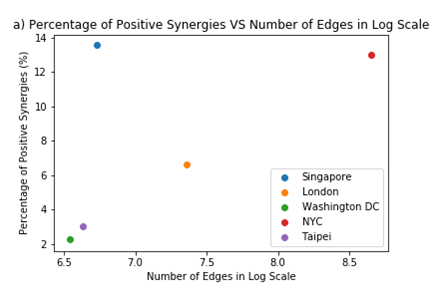
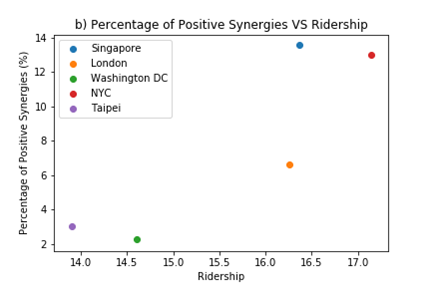
The figure (a) shows the percentage of positive synergies increases as the number of edges in log scale increases, though with the notable exception of Singapore, which has the highest percentage of positive synergies despite it being a smaller network. The presence of Singapore as an outlier may be due to the relatively higher volume of ridership, as seen in the figure (b) where the percentage of positive synergies is observed to increase with ridership.
This suggests that while synergies can be explained by complexity to a certain extent, other factors may be additionally important.
Synergies Explained by Network Topology
Positive synergy happens when


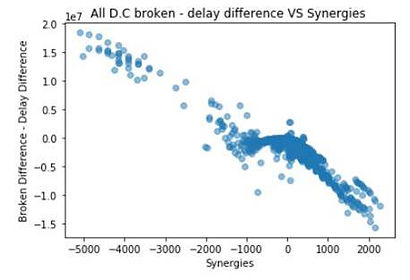
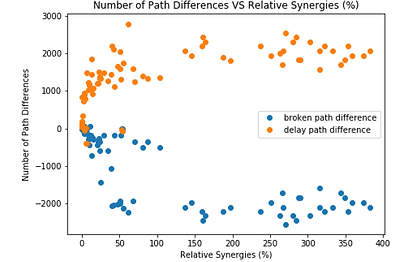
We conducted an analysis for the Washington, DC network, taking a closer look at both broken-path and delay-path differences.
The figure above shows station pair with the highest number of positive synergies. We found that single node disruption only results in delayed path, but when those two stations are shut down simultaneously, the top-right part of the subway system is broken, therefore results in more serious impacts. We then calculated the number of broken-path and delayed-path for single node disruption and pair node disruption. Then calculated the difference of this two scenarios.
The figure below shows the relationship between broken-path and delay-path differences, revealing that for station pairs with relative synergies higher than 150%, the number of broken-path differences is negative; the number of delay-path differences is positive. This suggests
that the initial single node disruption is converted to a broken-path, resulting in more significant impacts.
The results show that topology can explain around 80% of positive synergy effects for a smaller network like in DC. For a very large network like London, we found that the reason for positive synergy is more complicated with fewer positive synergies can be explained solely by topology. There is other effects like demand need to be included.
CONCLUSION
Theoretical Findings
-
All five cities exhibit positive synergies. (they seem to be inherent to subway networks!)
-
Pairs with high synergies often differ from those with high pair-node scores which usually are large transfer stations. By evaluating stations with high synergies can help us find the hidden pair of stations that have huge impacts when shutting down simultaneously.
-
Most (but not all) synergies can be observed through the network topology alone, independent of ridership and time delays.
-
Typical characteristics of pairs exhibiting high positive synergy:
-
from delay path to broken path
-
between 5 to 15 network distance
-
exhibit low disruptive score
Practical Applications and Next Steps
City Planning:
-
Use as a quantitative framework for planning of new routes, making systems more resilient in the face of disaster.
-
Create strategies for emergency situations, as well as maintenance projects to ensure minimal overall network disruption.
Future Research:
-
Gather data for more cities; will increase confidence in universality of effects, and new universalities may emerge.
SPONSOR


OUR TEAM
Members
Fangshu Lin, Alex Shannon, Rachel Lim Xin Rong, Sunglyong Kim
Acknowledgments
We would like to thank our mentor Stanislav Sobolevsky for his guidance and advice throughout the capstone project.

The London network comprises 660 nodes and 2274 edges which is by far the most complex network in our study. It is observed that in London network, the major transfer hubs such as King’s Cross St.Pancras, Euston, and London Bridge located at Central London are identified with the highest single node criticality score, this can be attributed to the high passenger activity in these stations. High criticality score is also observed for intersection on the route to outer London, such as Stockwell and Finsbury Park, since the disruption of those stations will affect all the stations beyond them on the route to outer London.
The Washington D.C. network is the smallest with 233 nodes and 696 edges. The highest criticality scores are observed in station downtown, where most people are exiting during the AM peak, signaling the role of these stations as gateway to work opportunities. Gallery Place Chinatown (in DC) has the highest criticality score and all stations are transfer nodes except Farragut North station. The interesting station is Rosslyn, which has very low passenger activities, but it has a very high number of critical score. The reason is similar to London, it’s a junction station that connect two out-skirt lines to downtown D.C.
